ANALYZE CROWDS
INTERESTING VISITS FOR SURE
OUR FLOWTRACK SYSTEM MEASURES MOVEMENT FLOWS IN YOUR BUILDING.
The anonymous visitor analysis can be used to optimize your processes and offers.

Flowtrack
- powerful counting
- totally anonymous
- llexible applications

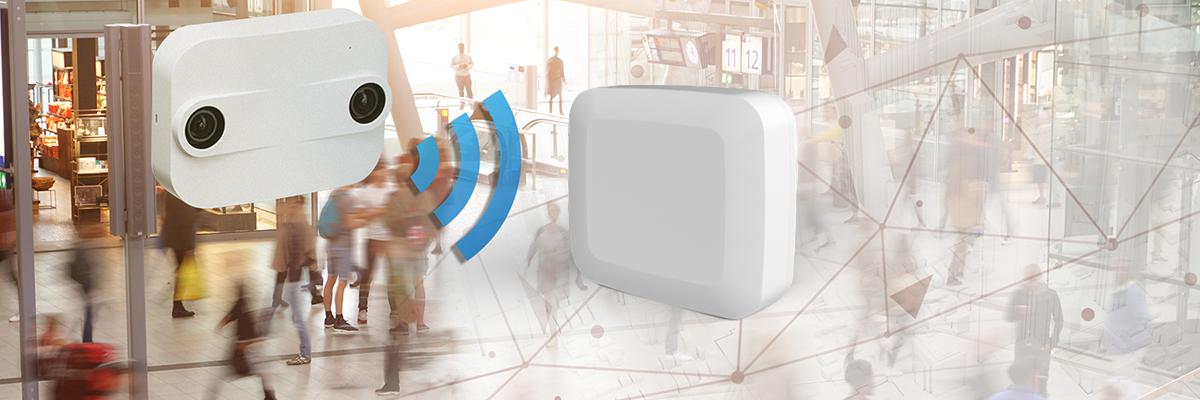
Gateway
- LAN / WLAN / LTE
- easy installation
- Optional: PoE, outdoor case
FlowTracking
The Google Analytics for your building
Understand people movements in buildings – in real time.
Flowtracking describes a procedure, in which movement flows are measured using sensors. The sensors passively search Bluetooth and WLAN signals emitted by mobile communication devices such as mobile telephones or tablets. Each of these devices is provided with a “digital fingerprint” or device-related Unique Identifier by the manufacturer. Individual digital fingerprints are however not important in flow-tracking. This is rather about aggregating many fingerprints and making statements about usage behaviours in buildings
IOT INFRASTRUCTURE PLANNING
FlowTrack sensor nodes are installed in buildings according to a systematic schema. They are ideally placed discreetly within close proximity to entrances, exits and stairs as well as before elevators on or below the ceiling. Neuralgic points, where paths cross or there are particular points of interests, are also suitable. Under optimal conditions, a single FlowTrack sensor covers a circular measuring area of up to 1,500 sqm. The measuring area can be affected by structural conditions.
INDOOR & OUTDOOR GEOTRACKING
A FlowTrack sensor node primarily measures three parameters: (1) the “digital fingerprint” of a device, (2) the time of entry into the measuring zone and (3) the time of exit from the measuring zone. The dwell time of the measured device in the measuring zone can already be determined from these three values.
ANONYMOUS FREQUENCY MEASUREMENT
Combined with a second FlowTrack sensor, the frequency time and frequency direction between two measuring zones can be determined. The Bluetooth or WLAN signals emitted by mobile communication devices are used as measuring unit. How much time has elapsed between the exit from a measuring area A and the entry into a measuring area B?
PHYSICAL LOCATION ANALYTICS
With the help of the measured “digital fingerprint”, it can be recognised as to how frequently a device was located in a measuring zone. Several times per hour, several times a day, several times per week, several times per month or several times per year – the return rate can be reflected in detail through a connected database.
SYNERGY EFFECTS BETWEEN MULTIPLE AREAS
Even synergy effects can be observed in this way. Do visitors also enter an area C if they have previously entered the areas A and B? Using the FlowTrack sensors, you can validate the success of the measures for increasing the visiting activity.

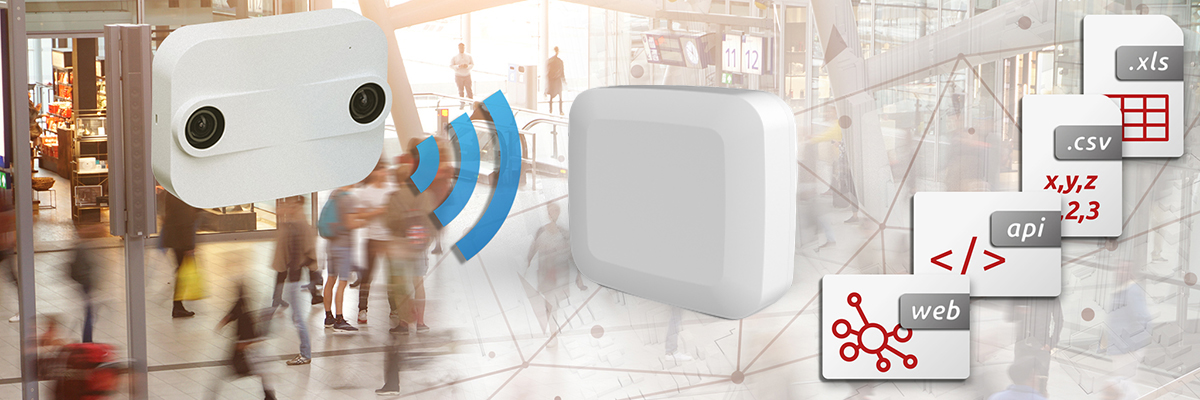
INTEGRATION OF MORE SENSORS & DATA STREAMS
By adding more data streams, e.g. rainfall or hours of sunshine from weather services as well as additional sensors such as number plate recognition or door counting systems, one can get even deeper insights into the events. Flowtrack can be integrated into almost every people counting system available in the market.
Examples of application
Small retail merchant
Small retail merchant
The owner of a small fashion store wants to measure and present KPIs such as number of visitors, dwell time and return rate. A complex installation and cabling of the required devices should be avoided.
Using FlowTrack, the desired KPIs can be recorded by measuring radio signals and can be presented in standardised reports. The hardware is manageable with at least one receiver / controller. Complex cabling can be omitted with an optional UMTS modem. Only power supply is needed. If necessary, an additional door counting camera can give more detailed insights into the events.
Visitor analyses in the shopping centre
In a large commercial property, the use of all entrances, the actual filling level of the building as well as the origin of the visitors based on number plate cameras should be recorded, evaluated and presented besides the number of visitors, dwell time and return rate. In addition, any change in the building’s filling level in relation to hours of sunshine or rainfall should be shown with the data stream of a weather service.
Using counting cameras at all entrances, radio receivers distributed in the entire building at neuralgic points like accesses or intersections as well as number plate cameras in parking lots and car parks, the desired KPIs can be recorded and evaluated. It is also possible to integrate weather data and to display it in clearly arranged reports.